
Keyword
Maritime transport
2 record(s)
Type of resources
Available actions
Topics
Keywords
Contact for the resource
Provided by
Formats
Representation types
Update frequencies
Status
Scale
panaceaKeywords
GEMET keywords
-
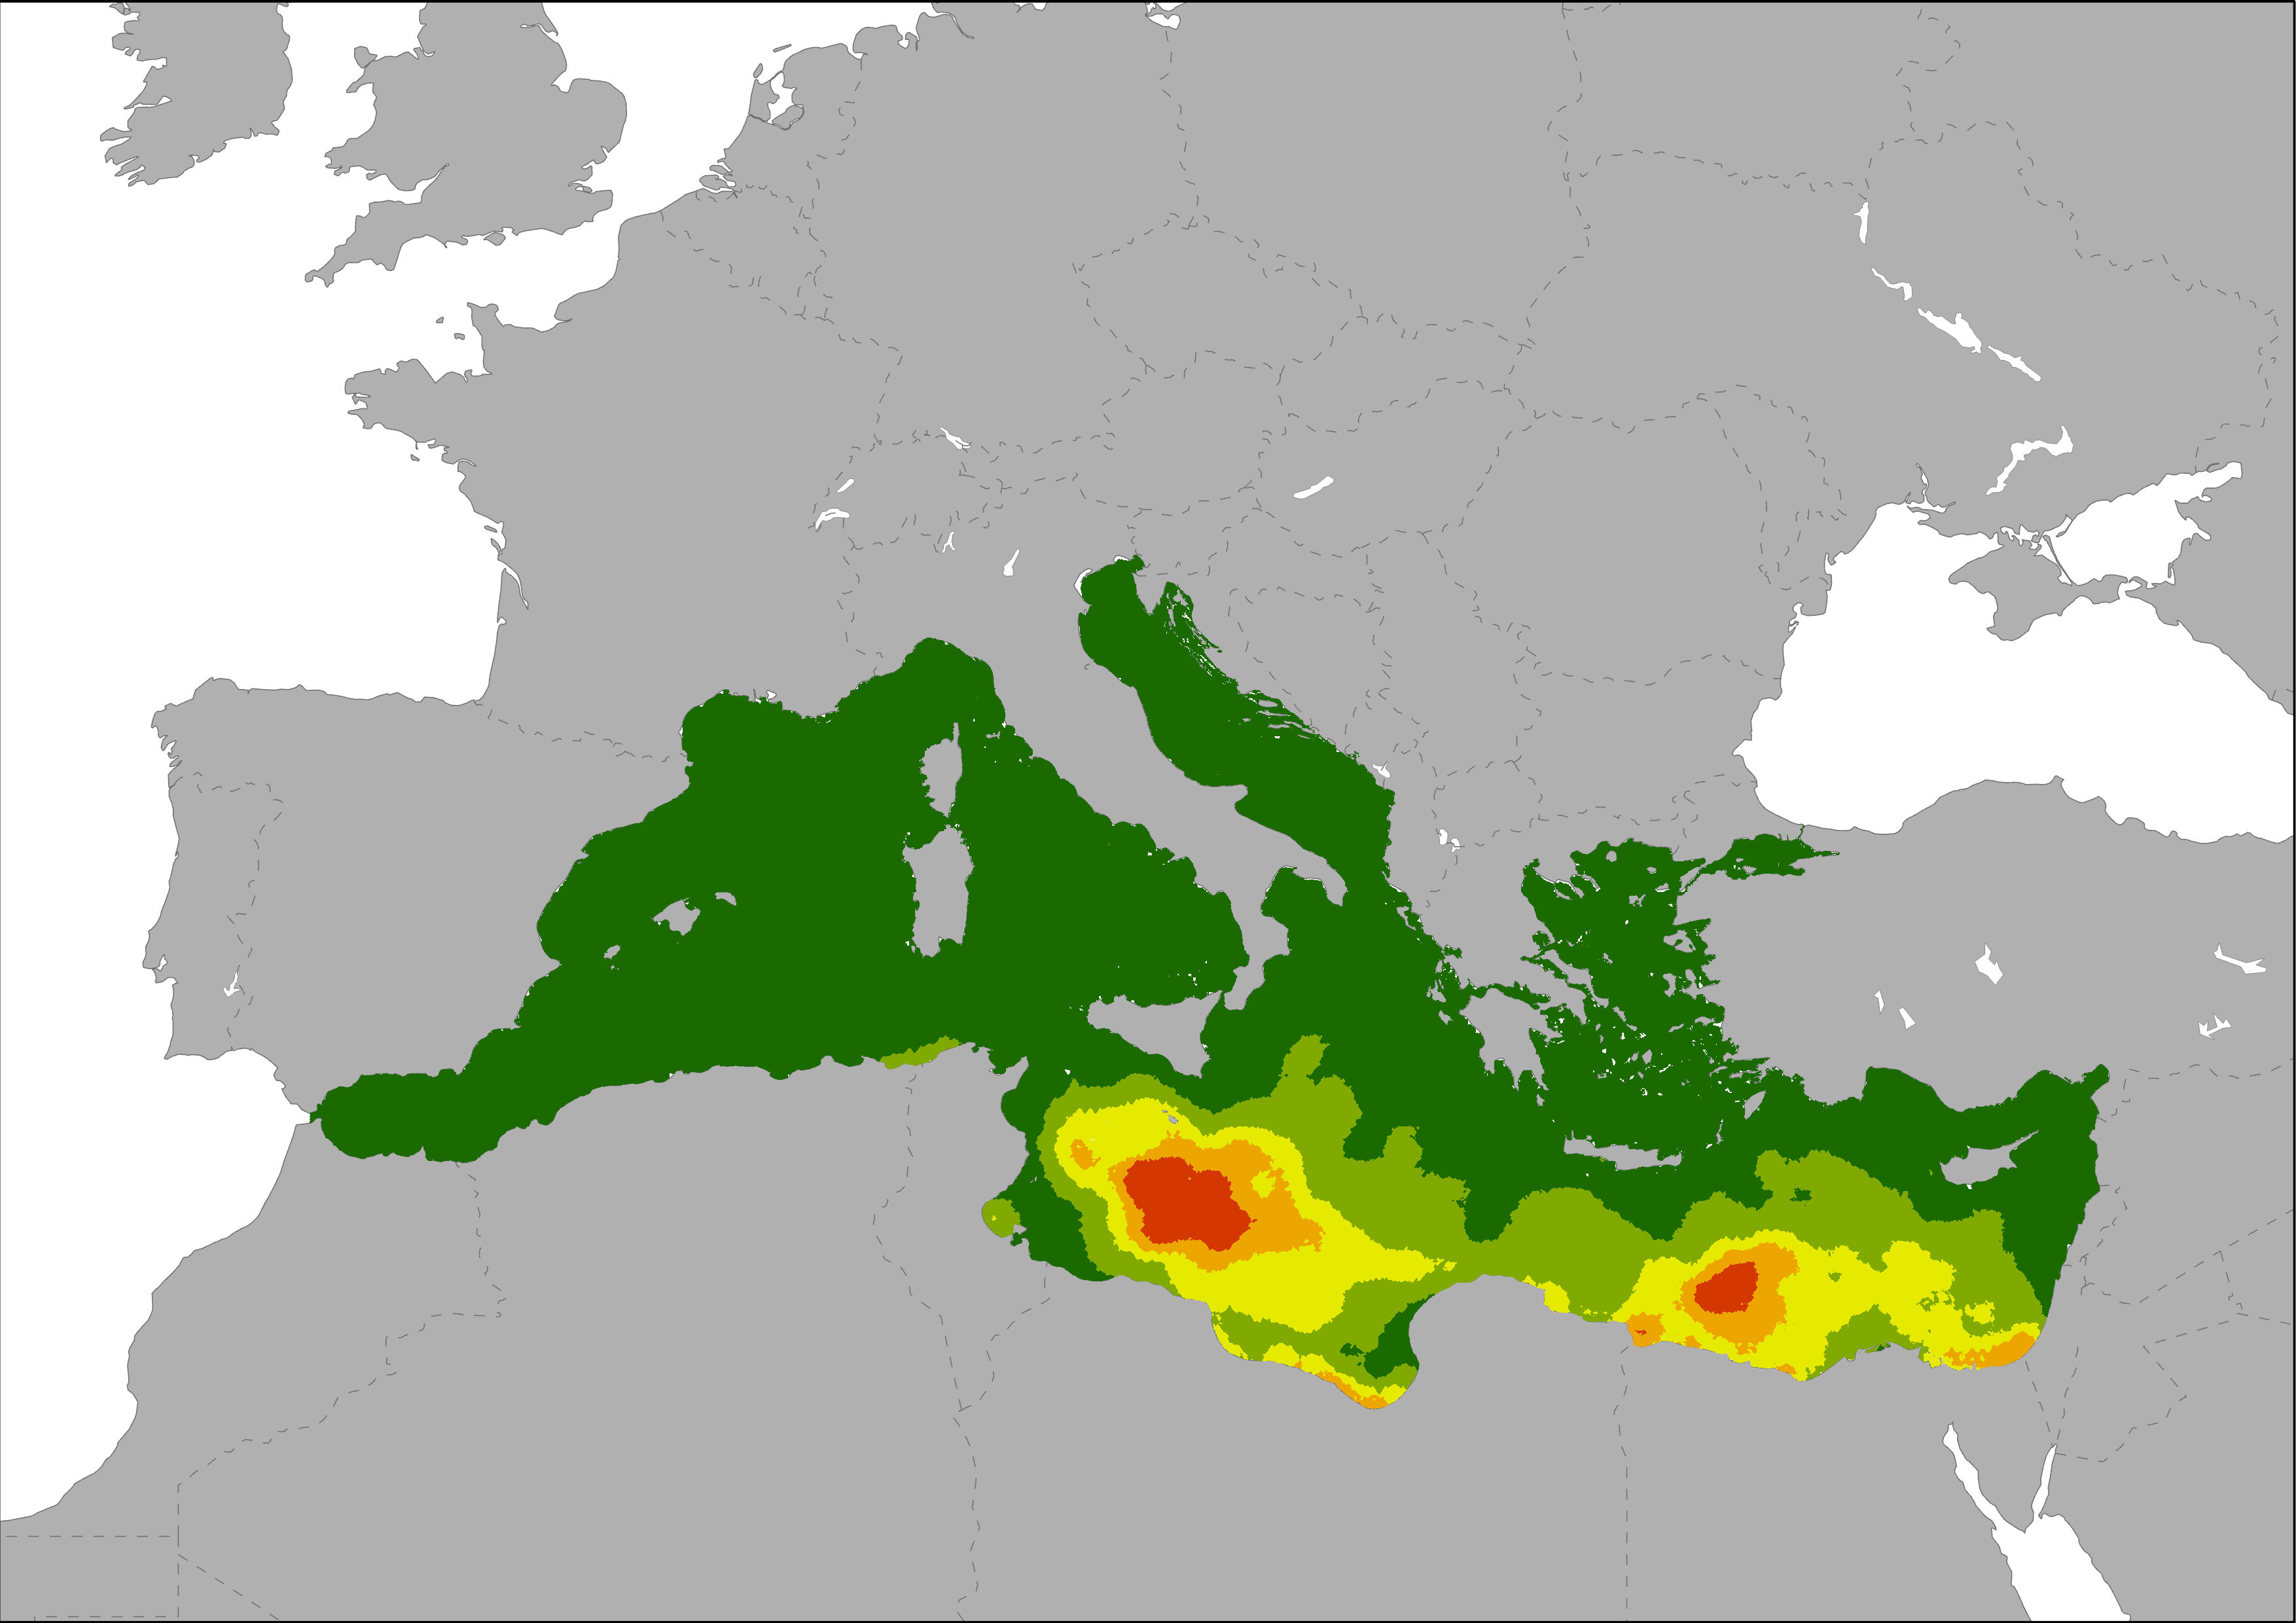
The indicators represent the distribution and degree of accumulation of marine in the Mediterranean Sea. Main source data were modelled by Lebreton et al., 2012 using a Lagrangian particle tracking model to simulate 30 years of input and transport of floating debris in the world’s ocean. The relative contribution of different sources to the total amount was taken into account in their model.
-
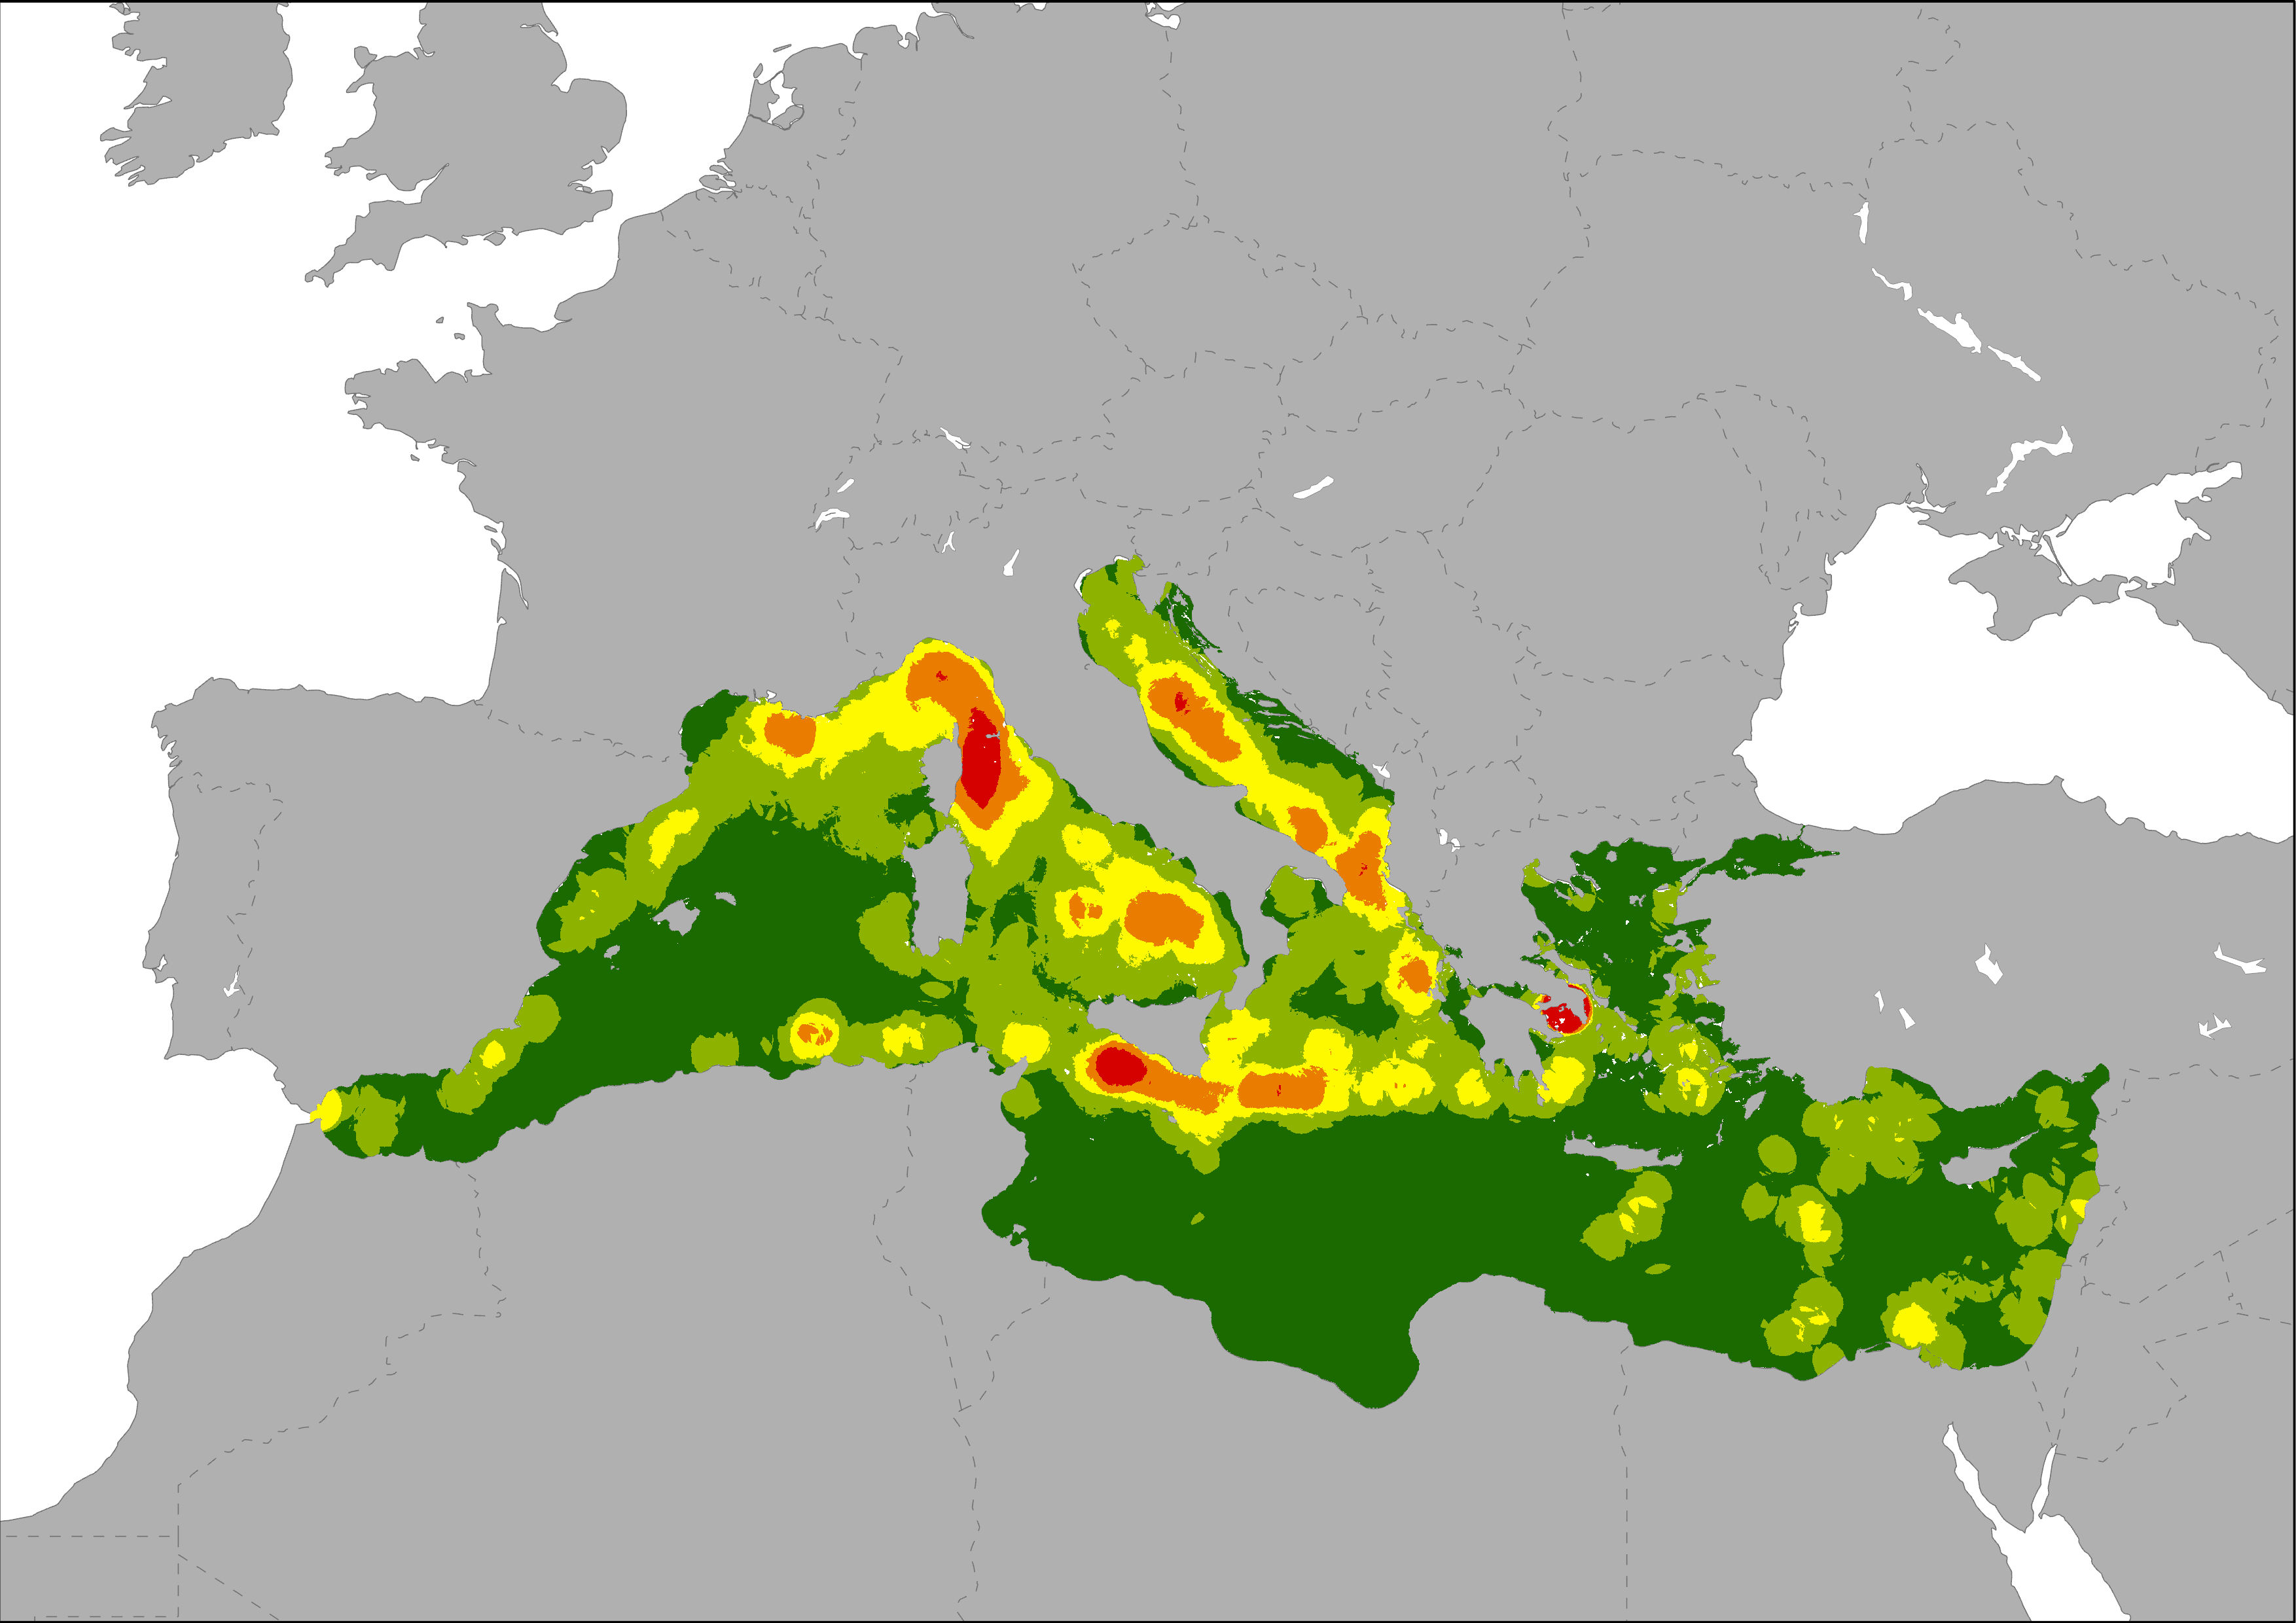
The map shows the spatial distribution of the frequency of oil spills in the Mediterranean Sea, indicating where the probability of an oil discharge is higher. Oil spills were represented as a density layer calculated using data on ship accidents and oil discharges registered by the Mandate of the Regional Marine Pollution Emergency Response Centre for the Mediterranean Sea (REMPEC), and also the oil spills map generated by Cinirella et al., 2012 (based on JRC data, 2009).